Top eCommerce Trends for Fourth of July
As we gear up for Fourth of July cookouts and celebrations with friends and family, we were curious to see what kind of products people were purchasing online ahead of the holiday. We analyzed our eCommerce data to see which trends rose to the top during the period leading up to the Fourth of July.
Scroll down to see what we discovered.
Friends and Family Gather Together for the Fourth
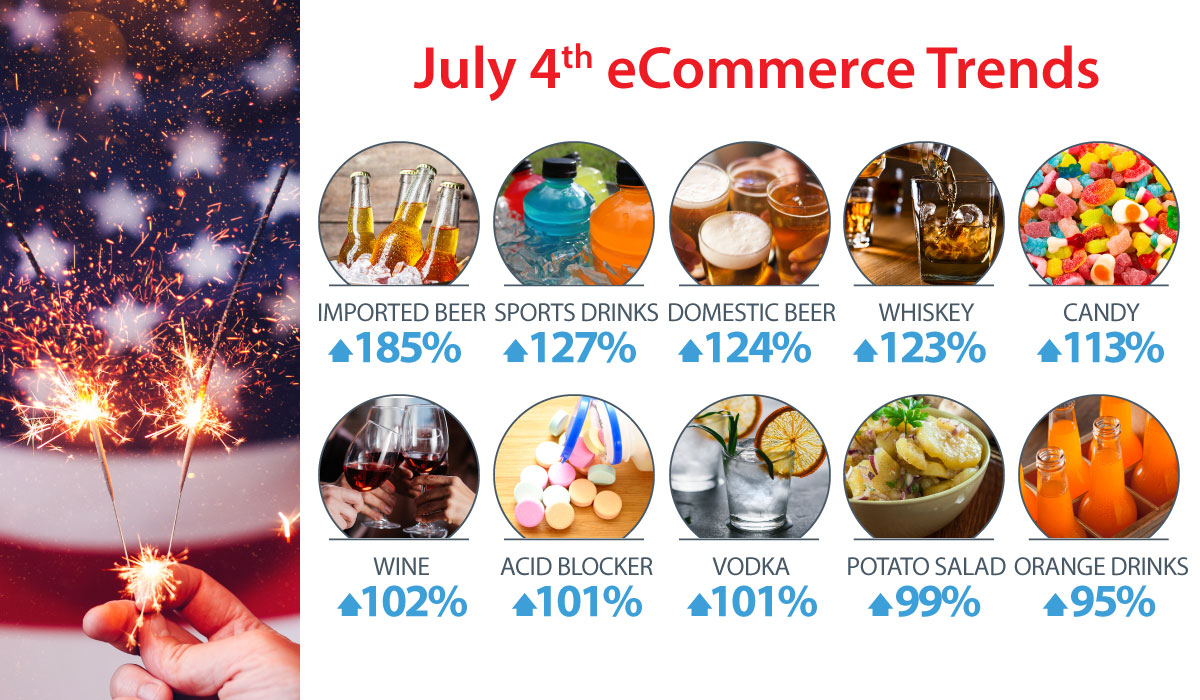
Our eCommerce data paints a story of summer get-togethers with food and drink. These trends can be an indicator of how people are preparing for Fourth of July celebrations. For example, there was a 113% sales lift in candy, 99% sales lift in potato salad, and a 101% sales lift in acid blocker to help all of the food settle during the week of 6/14/21 – 6/20/21 compared to the previous period.
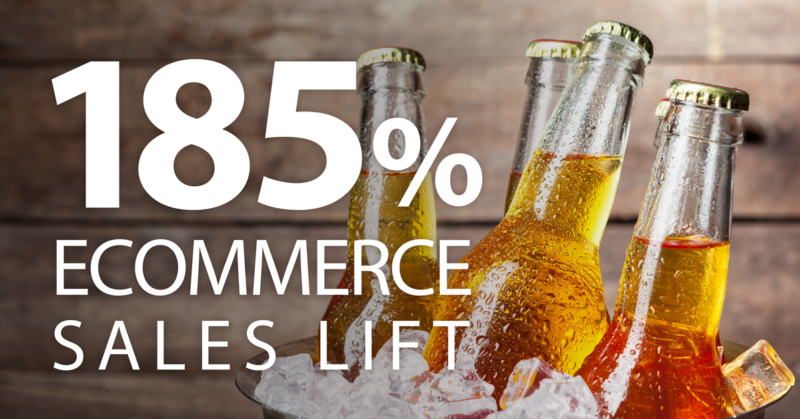
In terms of drinks, imported beer saw a 185% eCommerce sales lift and vodka had a 101% sales lift for the adults, while orange soft drinks for the kids also saw a 95% sales lift during the week of 6/14/21 – 6/20/21 compared to the previous period.

For brands, this represents a huge opportunity. When looking at 89B annual retail transactions from exclusive partnerships, Quotient Internal Reporting shows that 40% of shoppers who signed up for eCommerce services during the beginning of COVID (March – April, 2020) used eCommerce services again during the following months. Those same shoppers placed seven eCommerce orders on average—a 2X jump from the same period during the previous year.
Consumers may look to online grocery services for specific types of products, so advertisers can take advantage of this information to target shoppers with sponsored search ads and personalized promotions to incentivize purchases.
For more insight into how Quotient can help inform your future holiday campaign planning, get in touch with our team at communications@quotient.com.
Source: Quotient Internal Data (3/14/21 – 6/20/21)
Weekly trending eCommerce products are calculated based on weekly sales compared to average weekly sales for the three months prior, leaving a buffer of one month between the run week and the comparison period to account for trends.


