Understanding Movement During the COVID-19 Vaccine Rollout
Vaccine Rollout Impact on Movement to Grocery Stores, Pharmacies and Doctors’ Offices
The United States is months into the COVID-19 vaccine rollout, which officially started in December. As individuals become vaccinated, we will likely see a shift in consumer behavior as people are able to resume activities that were limited during COVID. But even the location of the vaccination appointment has the potential to affect buying habits.
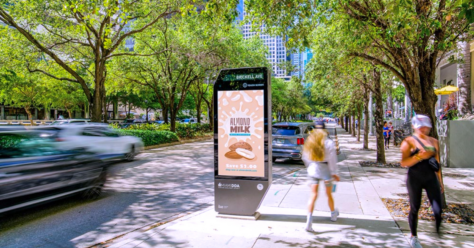
Currently, the U.S. is vaccinating at a rate of 3.06 million doses a day. Many of these doses are administered at grocery stores, pharmacies and doctors’ offices. After receiving a dose, the CDC recommends a 15-minute waiting period before leaving the vaccination location. In this time, people may choose to pick up extra supplies from the grocery store or pharmacy where they get their vaccine—creating an opportunity for brands and advertisers.
To understand the impact of the vaccine rollout on foot traffic to vaccination locations, Quotient is launching a dashboard that monitors movement to grocery stores, pharmacies and doctors’ offices. These locations are based on the list of Federal Pharmacy Partners and CDC-registered doctors’ offices. With this dashboard, you can see movement nationally across these categories, in addition to movement by Designated Marketing Areas (DMAs). These views will allow you to find areas of opportunity across regions and locations.
Identifying Opportunities
On the Quotient Vaccination Dashboard, you can choose the DMAs you are interested in seeing via the dropdown menu. The dashboard will highlight the changes in movement each week compared to movement in the pre-vaccine rollout baseline period (9/7/20-12/13/20).
Brands and advertisers can connect with customers locally or nationally to provide relevant messaging, informing them of products or offerings that could be useful during this time post-vaccination or as a quick in-store pickup. The current opportunity to reach customers at their vaccination locations is unprecedented, since the goal is to vaccinate over 500 million Americans. This is a time to reach new consumers and connect with existing consumers who are coming into pharmacy and retail locations.
Using the Dashboard
This dashboard provides two views of movement at locations that may be offering the COVID-19 vaccine. Those views include:
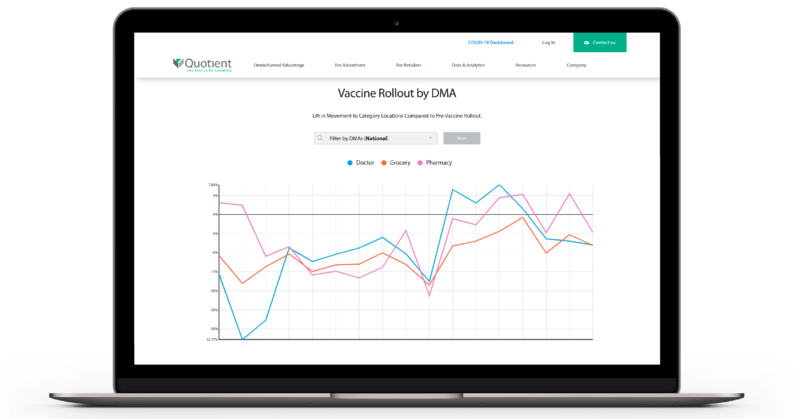
DMA View: comparing the categories for each DMA
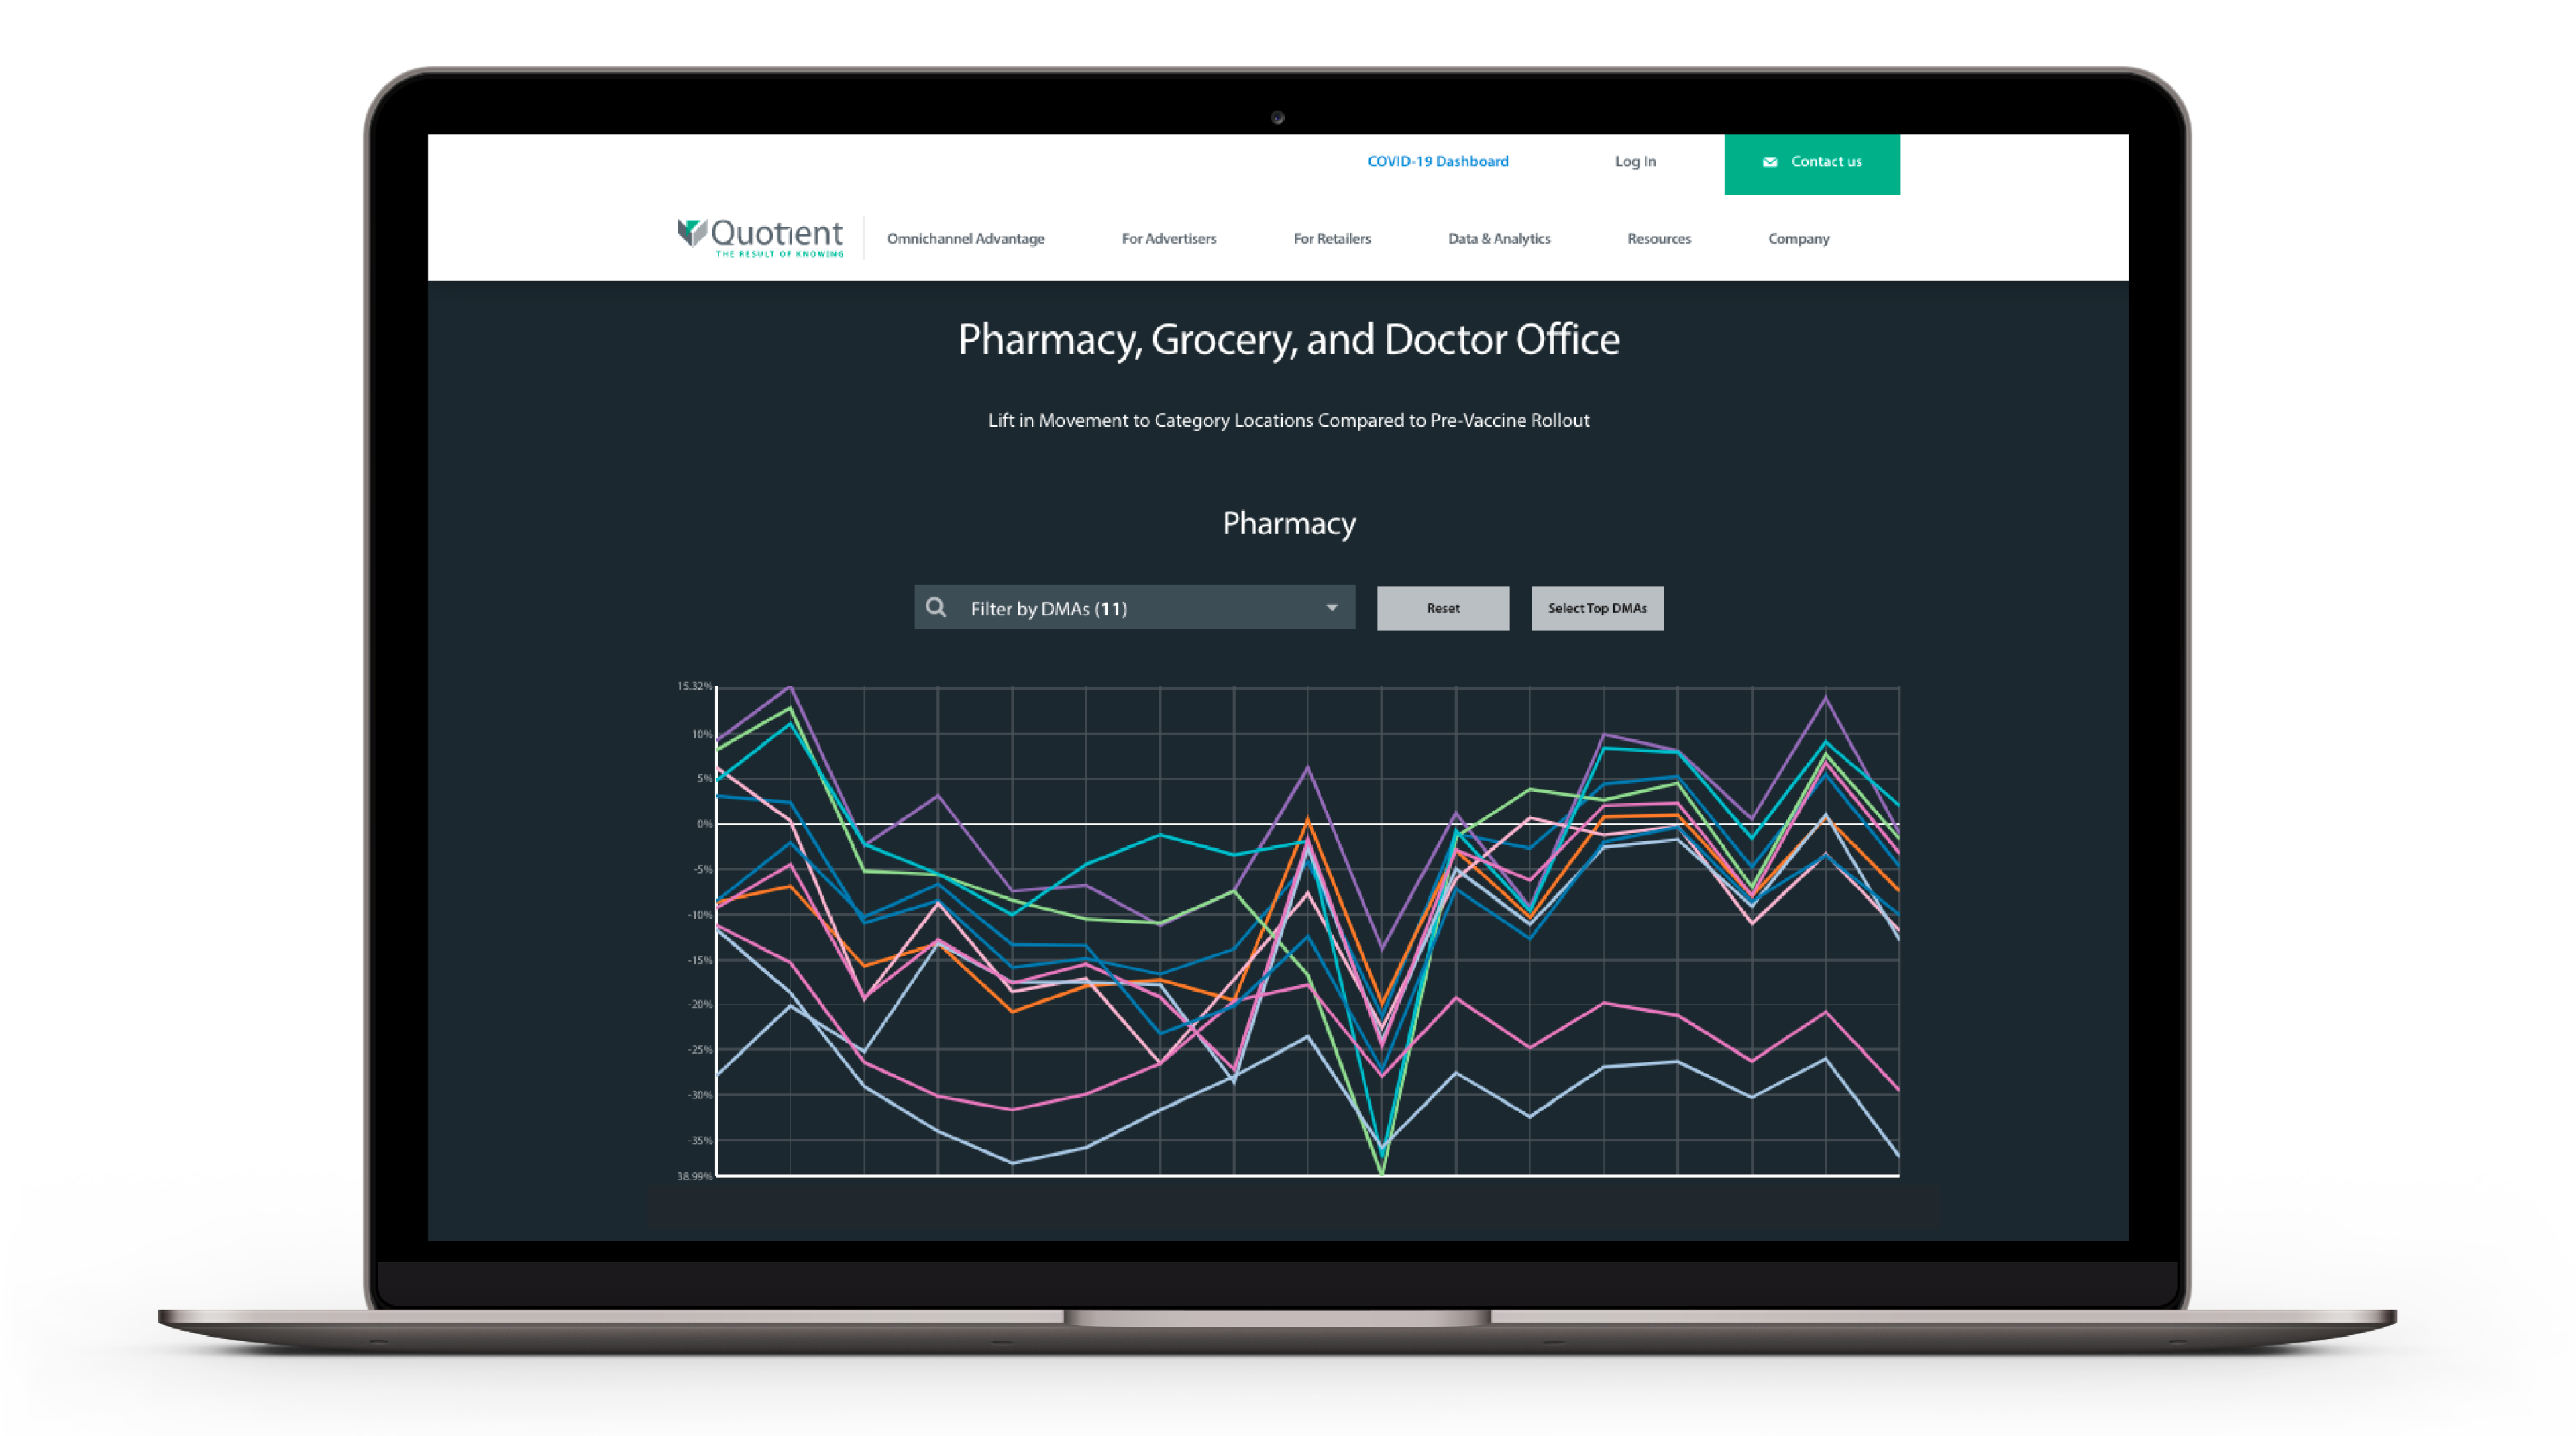
Category View: comparing DMAs for each category
To compare movement across all the categories for one DMA, use the DMA View by selecting the DMA of interest from the drop-down menu. The chart is pre-populated with the national averages across each category. You can select one DMA to examine at a time. This DMA View will present the differences week-over-week in movement of each category compared to the pre-vaccine rollout period.
For example, during the week of March 8 through March 14, movement at pharmacy retailers offering vaccines was 4.4% above pre-vaccine rollout levels.
To compare multiple DMAs for a single category (e.g., grocery stores), use the Category View to select the DMAs you are interested in from the drop-down menu. The charts are pre-populated with the DMAs that have the highest levels of movement for each category. You can select all the DMAs you are interested in comparing. This Category View will help you understand the differences in week-over-week movement across DMAs for a specific category.
For example, at grocery stores the week of March 8 through March 14, movement at grocery retailers offering vaccines was up 4.6% in Houston but down -4.6% compared to the pre-vaccine rollout levels of movement.
For the full dashboard of results, click here.
Methodology
To conduct this analysis, Quotient is analyzing movement around 115k+ grocery stores, pharmacies and doctors’ offices nationwide with a radius of 0.04 miles and dwell time limits applied. Lift is calculated by taking the percent change in visitors observed compared to the baseline week-over-week. The baseline is calculated based on average visitors observed by DMA between the weeks of 9/7/20-12/13/20 and compared to visitors after the vaccine rollout started on 12/14/20.
This independent analysis is based on Quotient's location intelligence platform. Quotient's data is anonymized and aggregated.


